Histogram
-
This module explains how to create and customize histograms in Matplotlib using
plt.hist(). You will learn about data distribution, the bins concept, styling options like edge color and transparency, and how to compare multiple histograms effectively.
Histogram
Shows frequency distribution of numerical data.
Use Case:
Age distribution
Salary distribution
In Matplotlib, we use the hist() function to create histograms.
The hist() function will use an array of numbers to create a histogram, the array is sent into the function as an argument.
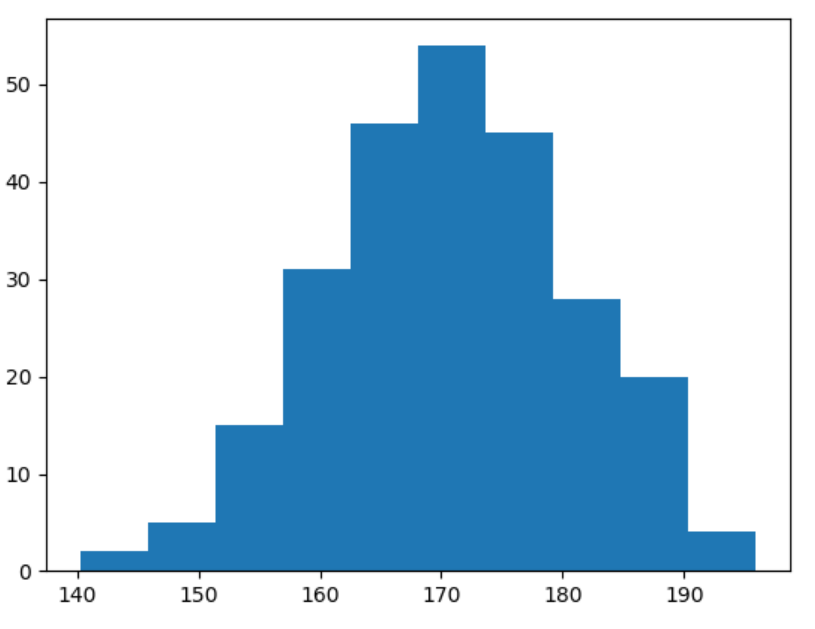
Histogram for Normally Distributed Data
This code generates a histogram using randomly created data that follows a normal distribution.
import matplotlib.pyplot as plt
import numpy as np
x = np.random.normal(170, 10, 250)
plt.hist(x)
plt.show()