Bar Chart
- This module teaches how to create bar charts in Matplotlib, including vertical and horizontal bar plots. You will learn to build multiple bar charts, adjust bar width, and add data labels for better data presentation in Python.
Bar Chart
Used to compare categories.
Use Case:
Comparing sales by region
Employee performance
Product comparison
Basic Bar Chart for Category Comparison
This code creates a simple bar chart using the Python library Matplotlib. It compares different categories (A, B, C, D) based on their corresponding numerical values (3, 8, 1, 10).
import matplotlib.pyplot as plt
import numpy as np

x = np.array(["A", "B", "C", "D"])
y = np.array([3, 8, 1, 10])

plt.bar(x,y)
plt.show()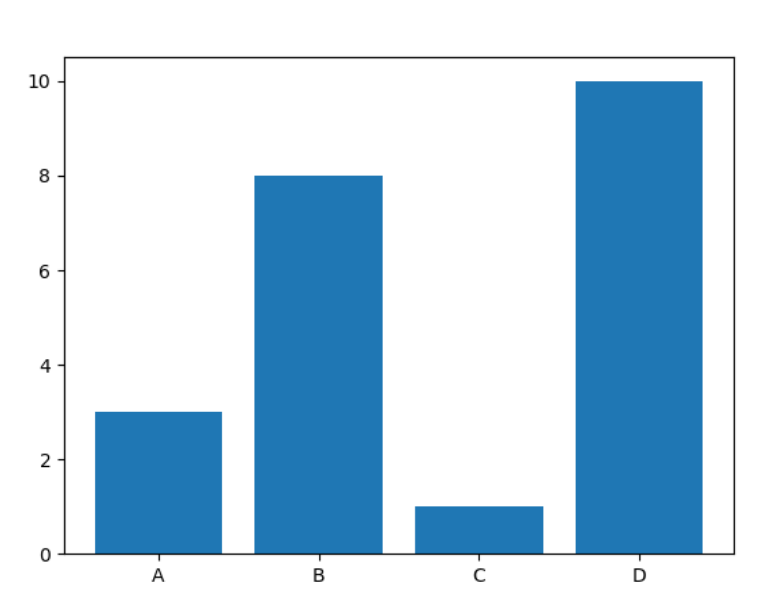
Horizontal Bars
If you want the bars to be displayed horizontally instead of vertically, use the barh() function:
Horizontal Bar Chart for Category Comparison
This code creates a horizontal bar chart using the barh() function from the Matplotlib library. Instead of vertical bars, the categories (A, B, C, D) are displayed on the y-axis, and their corresponding values (3, 8, 1, 10) are shown on the x-axis.
import matplotlib.pyplot as plt
import numpy as np

x = np.array(["A", "B", "C", "D"])
y = np.array([3, 8, 1, 10])

plt.barh(x, y)
plt.show()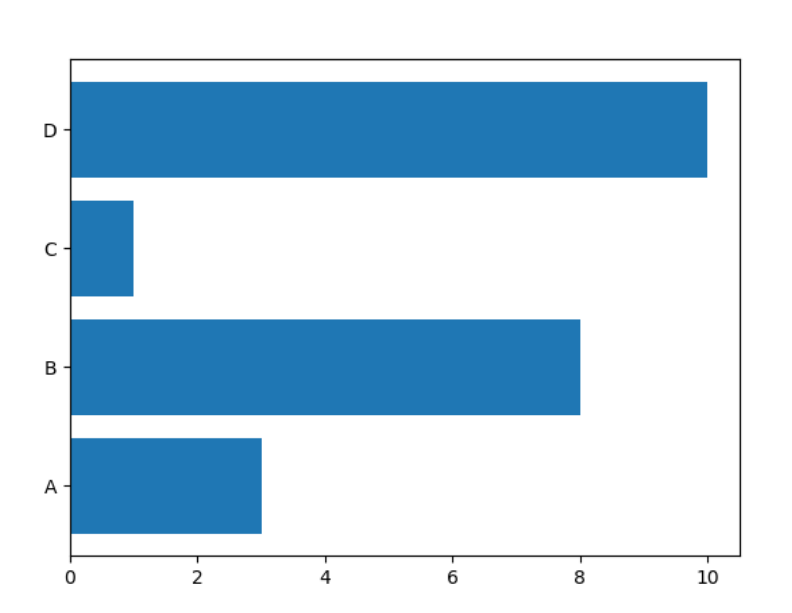
- Color Names
Bar Chart with Color Customization
This code creates a bar chart using Matplotlib and applies a custom color ("hotpink") to the bars using the color parameter inside the plt.bar() function.
import matplotlib.pyplot as plt
import numpy as np

x = np.array(["A", "B", "C", "D"])
y = np.array([3, 8, 1, 10])

plt.bar(x, y, color = "hotpink")
plt.show()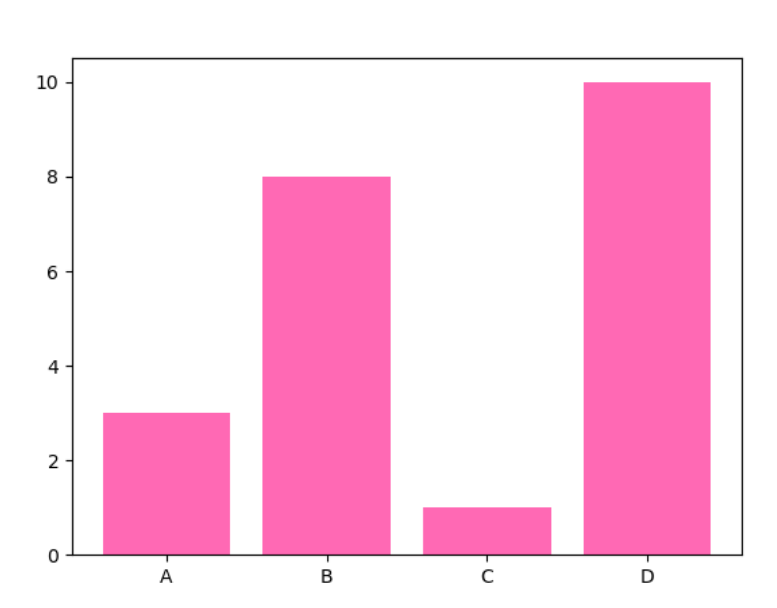
Bar Width
The bar() takes the keyword argument width to set the width of the bars:
Bar Chart with Custom Bar Width
This code creates a bar chart and adjusts the width of the bars using the width parameter inside the plt.bar() function.
import matplotlib.pyplot as plt
import numpy as np

x = np.array(["A", "B", "C", "D"])
y = np.array([3, 8, 1, 10])

plt.bar(x, y, width = 0.1)
plt.show()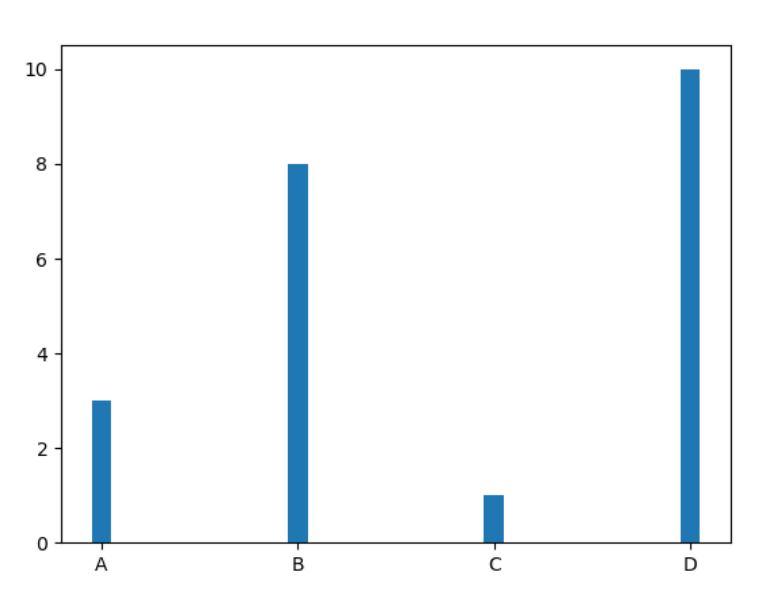
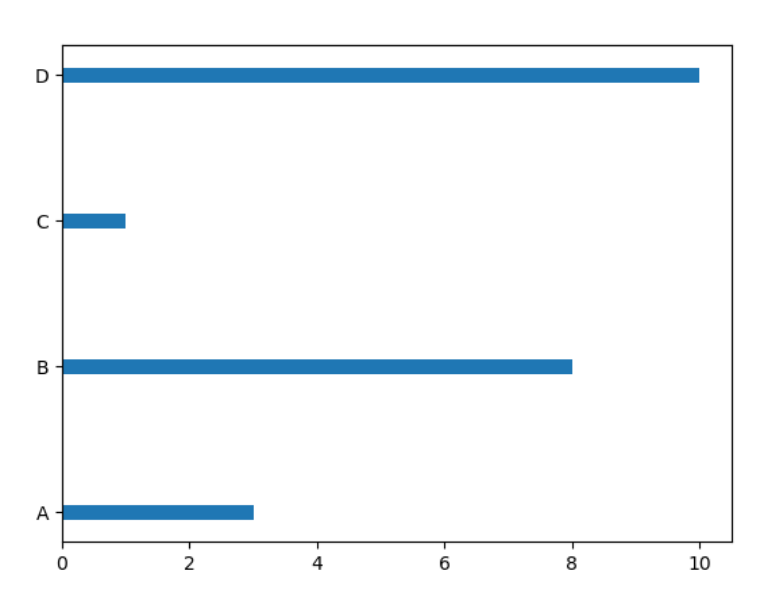
Bar Height
The barh() takes the keyword argument height to set the height of the bars:
Horizontal Bar Chart with Custom Bar Height
This code creates a horizontal bar chart using plt.barh() and adjusts the thickness of the bars using the height parameter.
import matplotlib.pyplot as plt
import numpy as np

x = np.array(["A", "B", "C", "D"])
y = np.array([3, 8, 1, 10])

plt.barh(x, y, height = 0.1)
plt.show()