Box Plot
- This module explains how to create box plots in Seaborn to understand quartiles, detect outliers, compare categories, and apply custom styling for better data analysis and visualization in Python.
What is a Box Plot?
A Box Plot (also called Box and Whisker Plot) is used to visualize:
Data distribution
Quartiles
Median
Spread of data
Outliers
It is very important in Exploratory Data Analysis (EDA).
Understanding Quartiles
Theory
Box plot is based on five-number summary:
Minimum
Q1 (First Quartile – 25%)
Median (Q2 – 50%)
Q3 (Third Quartile – 75%)
Maximum
Visual Structure of Box Plot
Min ────|──── Q1 ─── [ Median ] ─── Q3 ───|──── Max
Important Concept
IQR (Interquartile Range)
IQR = Q3 – Q1
It shows the middle 50% of the data.
Example Code
Distribution of Total Bill – Box Plot
This code creates a box plot to visualize the distribution of the total_bill column from the tips dataset.
import seaborn as sns
import matplotlib.pyplot as plt

tips = sns.load_dataset("tips")

sns.boxplot(y="total_bill", data=tips)
plt.title("Box Plot of Total Bill")
plt.show()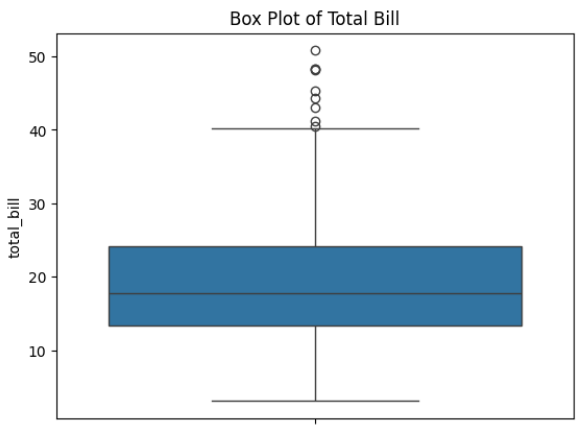
🖼 Output Explanation
Middle line → Median
Box → Q1 to Q3
Whiskers → Min & Max (within range)
Dots outside → Outliers
If box is large → High variation
If median is not centered → Data is skewedDetecting Outliers
Theory
Outliers are values that are:
Extremely high
Extremely low
Far from other observations
Box plot automatically detects outliers using:
Lower Limit = Q1 - 1.5 * IQR
Upper Limit = Q3 + 1.5 * IQR
Values outside this range are shown as dots.
Example
sns.boxplot(y="tip", data=tips)
plt.title("Detecting Outliers in Tips")
plt.show()
Output Explanation
Small dots above whisker → High tip outliers
Helps identify unusual customer behavior
Comparing Categories
Theory
Box plot is very powerful for:
Comparing distribution across groups
Checking variation between categories
Example — Compare Total Bill by Day
Total Bill Distribution by Day – Box Plot
This code creates a grouped box plot to compare the distribution of total bills across different days of the week.
sns.boxplot(x="day", y="total_bill", data=tips)
plt.title("Total Bill Distribution by Day")
plt.show()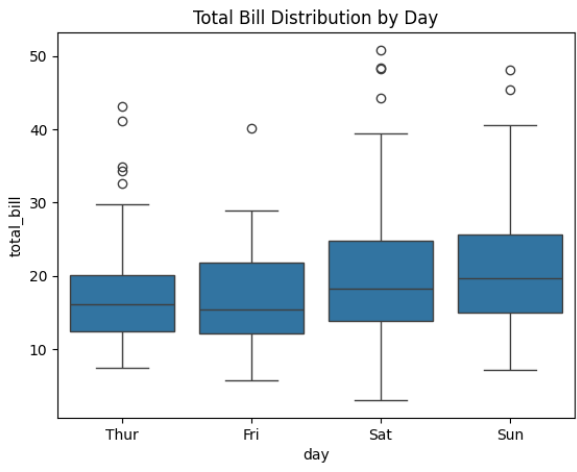
Output Explanation
X-axis → Days
Y-axis → Total Bill
Each box → Distribution for each day
Insights Example:
Saturday may have higher median
Sunday may have more spread
Some days may have more outliers
Example — Using Hue (Multiple Category Comparison)
Total Bill by Day and Gender – Grouped Box Plot
This code creates a grouped box plot to compare the distribution of total bills across different days, separated by gender.
sns.boxplot(x="day", y="total_bill", hue="sex", data=tips)
plt.title("Total Bill by Day and Gender")
plt.show()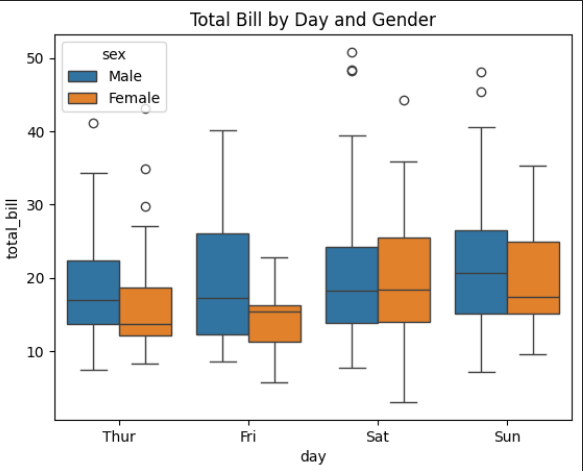
Output Explanation:
Two colored boxes per day
Compare Male vs Female spending
Custom Styling in Box Plot
Change Color
sns.boxplot(x="day", y="total_bill", data=tips, palette="Set2")Horizontal Box Plot
sns.boxplot(y="day", x="total_bill", data=tips)Remove Outliers
sns.boxplot(x="day", y="total_bill", data=tips, showfliers=False)Add Mean Line
sns.boxplot(x="day", y="total_bill", data=tips, showmeans=True)