Box Plot
-
This module explains how to create and customize box plots in Matplotlib using
plt.boxplot(). You will learn about quartiles, outlier detection, vertical and horizontal box plots, and various customization options for better data analysis.
Box Plot
Shows distribution, median, and outliers.
Use Case:
Salary spread
Exam score analysis
A Box Plot (or Whisker plot) display the summary of a data set, including minimum, first quartile, median, third quartile and maximum. it consists of a box from the first quartile to the third quartile, with a vertical line at the median. the x-axis denotes the data to be plotted while the y-axis shows the frequency distribution. The matplotlib.pyplot module of matplotlib library provides boxplot() function with the help of which we can create box plots.
Syntax
matplotlib.pyplot.boxplot(data)
The data values given to the ax.boxplot() method can be a Numpy array or Python list or Tuple of arrays. Let us create the box plot by using numpy.random.normal() to create some random data, it takes mean, standard deviation, and the desired number of values as arguments.
Example:
Box Plot for Normally Distributed Data
This code generates a box plot to visualize the distribution of randomly created data.
import matplotlib.pyplot as plt
import numpy as np
np.random.seed(10)
d = np.random.normal(100, 20, 200)
fig = plt.figure(figsize =(10, 7))
plt.boxplot(d)
plt.show()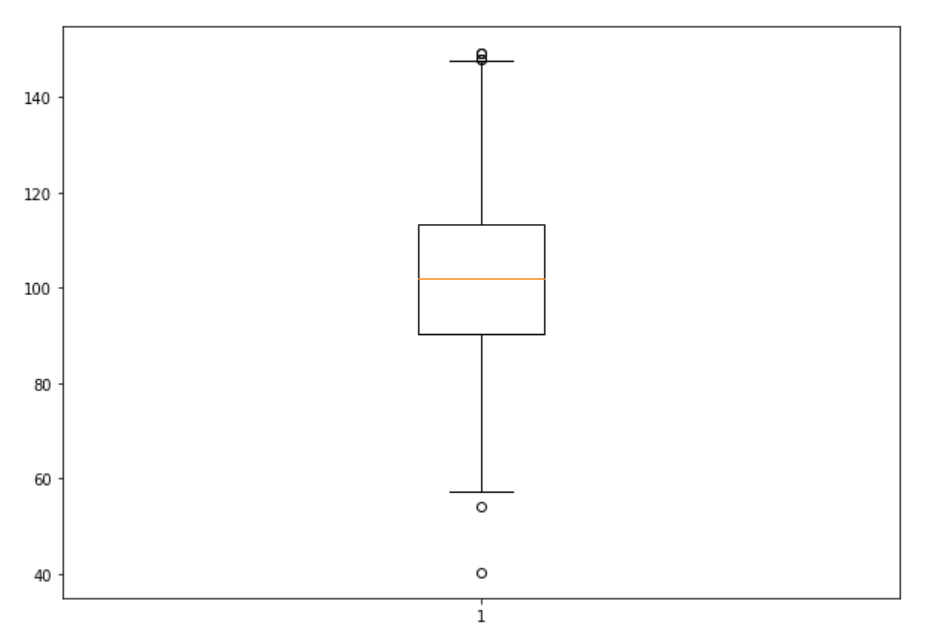
Customizing Box Plot
The matplotlib.pyplot.boxplot() provides endless customization possibilities to the box plot. some of the key customization parameters include:
The notch: True attribute creates the notch format to the box plot
patch_artist: True fills the boxplot with colors, we can set different colors to different boxes.
vert: 0 attribute creates horizontal box plot.
labels: specifies custom labels for the boxes.
Example 1: Multiple Datasets Box Plot
Comparative Box Plot for Multiple Datasets
This code creates multiple box plots in a single figure to compare the distributions of four different datasets.
import matplotlib.pyplot as plt
import numpy as np
np.random.seed(10)
d_1 = np.random.normal(100, 10, 200)
d_2 = np.random.normal(90, 20, 200)
d_3 = np.random.normal(80, 30, 200)
d_4 = np.random.normal(70, 40, 200)
d = [d_1, d_2, d_3, d_4]
fig = plt.figure(figsize =(10, 7))
ax = fig.add_axes([0, 0, 1, 1])
bp = ax.boxplot(d)
plt.show()