Polynomial Regression
- This module explains Polynomial Regression and how it models non-linear relationships using polynomial features while understanding the impact of model complexity.
Polynomial Regression
Polynomial Regression is an extension of Linear Regression used when the relationship between variables is non-linear.
Even though it models curves, it is still considered a linear model because it is linear in coefficients.
Non-Linear Relationships
What is a Non-Linear Relationship?
When the relationship between X and Y is not a straight line.
Example
Suppose:
As study hours increase, marks increase rapidly at first
After some time, the increase slows down
This creates a curve, not a straight line.
Linear vs Polynomial
Linear Equation:
Y=mX+cY = mX + cY=mX+c
Polynomial Equation (Degree 2):
Y=aX2+bX+cY = aX^2 + bX + cY=aX2+bX+c
Higher Degree Example:
Y=aX3+bX2+cX+dY = aX^3 + bX^2 + cX + dY=aX3+bX2+cX+d
Polynomial Features
In Polynomial Regression, we transform original features into polynomial features.
Example:
If:
X=2X = 2X=2
Polynomial Features (degree = 3):
[1,X,X2,X3]=[1,2,4,8][1, X, X^2, X^3] = [1, 2, 4, 8][1,X,X2,X3]=[1,2,4,8]
So instead of just X, the model learns using:
X
X²
X³
This allows it to fit curved data.
Model Complexity
Low Degree (Underfitting)
Degree = 1 → Straight line
May not capture complex patterns.High Degree (Overfitting)
Degree = 10 → Very complex curve
May fit noise instead of pattern.Goal
Choose optimal degree to balance:
Bias
Variance
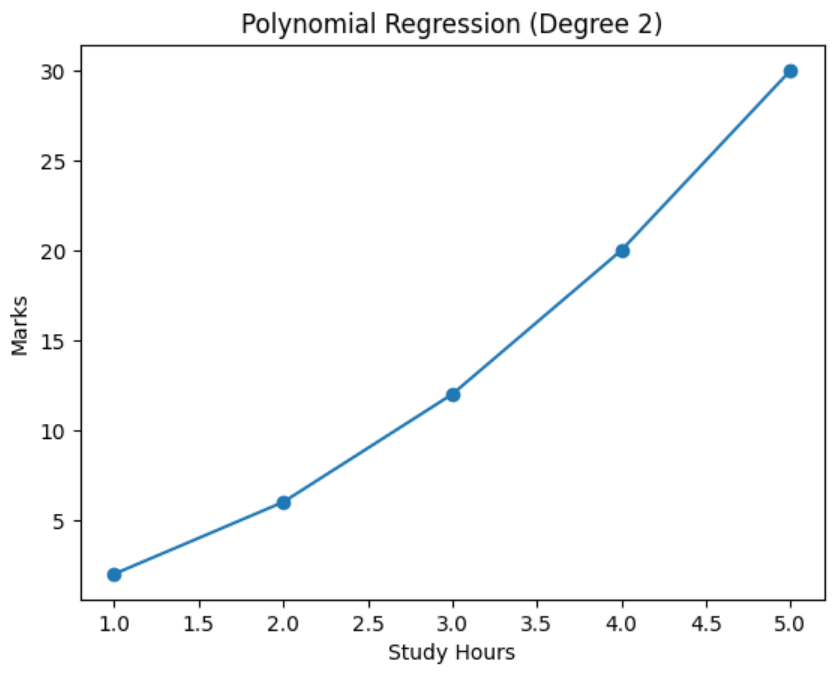
Example: Study Hours vs Marks (Non-linear)
Polynomial Regression (Degree 2) Using Python
This code demonstrates how to perform Polynomial Regression using Python. It converts linear input data into polynomial features (degree 2), trains a Linear Regression model, makes predictions, and visualizes the non-linear relationship between study hours and marks using a graph.
# Step 1: Import Libraries
import numpy as np
import matplotlib.pyplot as plt
from sklearn.linear_model import LinearRegression
from sklearn.preprocessing import PolynomialFeatures

# Step 2: Create Dataset
X = np.array([1, 2, 3, 4, 5]).reshape(-1, 1)
y = np.array([2, 6, 12, 20, 30])  # Non-linear pattern

# Step 3: Convert to Polynomial Features (degree = 2)
poly = PolynomialFeatures(degree=2)
X_poly = poly.fit_transform(X)

# Step 4: Train Model
model = LinearRegression()
model.fit(X_poly, y)

# Step 5: Predictions
y_pred = model.predict(X_poly)

# Step 6: Plot Graph
plt.scatter(X, y)            # Actual data
plt.plot(X, y_pred)          # Polynomial curve
plt.xlabel("Study Hours")
plt.ylabel("Marks")
plt.title("Polynomial Regression (Degree 2)")
plt.show()

# Step 7: Print Coefficients
print("Intercept:", model.intercept_)
print("Coefficients:", model.coef_)
Output:
Intercept: 3.552713678800501e-15
Coefficients: [0. 1. 1.]