Hierarchical Clustering
- Hierarchical clustering is an unsupervised learning technique that creates nested clusters by merging or splitting data groups based on similarity.
Hierarchical Clustering
Hierarchical Clustering is an unsupervised learning algorithm used to group similar data points into a hierarchy of clusters. Unlike K-Means, it does not require specifying the number of clusters upfront.
Agglomerative Clustering (Bottom-Up)
Starts with each data point as its own cluster
Iteratively merges the closest clusters
Stops when all points belong to one cluster or a distance threshold is reached
Steps:
Assign each point to its own cluster
Compute distances between all clusters
Merge the closest clusters
Repeat until all points merge into a single cluster
Divisive Clustering (Top-Down)
Starts with all points in one cluster
Iteratively splits clusters into smaller clusters
Continues until each point is its own cluster
Dendrogram
A dendrogram is a tree-like diagram showing hierarchical relationships between clusters.
Y-axis → Distance at which clusters are merged
X-axis → Data points
Can cut the dendrogram at a certain height to select the number of clusters
Example Dendrogram Interpretation
Short distance → Similar points
Tall branches → Less similar points
Cut the tree → Desired number of clusters
Linkage Methods
Linkage defines distance between clusters when merging.
Example: Agglomerative Clustering
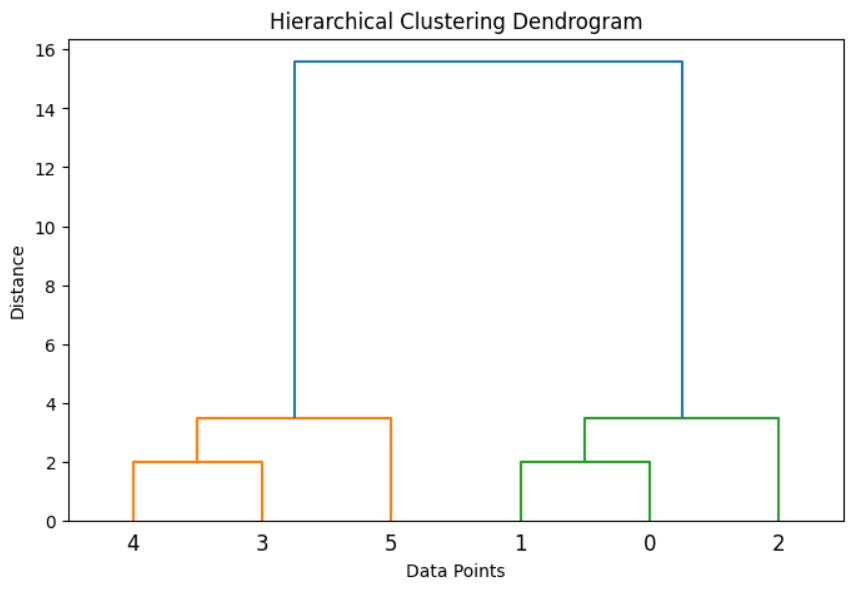
Hierarchical Clustering Example in Python with Dendrogram
This Python example demonstrates how to perform Hierarchical Clustering using Agglomerative Clustering. The code first creates a dataset and generates a dendrogram using the Ward linkage method to visualize how data points are merged step by step. After analyzing the dendrogram, the model groups the data into two clusters and prints the cluster labels.
# Step 1: Import Libraries
import numpy as np
import matplotlib.pyplot as plt
from scipy.cluster.hierarchy import dendrogram, linkage
from sklearn.cluster import AgglomerativeClustering

# Step 2: Create Dataset
X = np.array([
    [1, 2],
    [1, 4],
    [1, 0],
    [10, 2],
    [10, 4],
    [10, 0]
])

# Step 3: Create Linkage Matrix for Dendrogram
linked = linkage(X, method='ward')  # 'ward', 'single', 'complete', 'average'

# Step 4: Plot Dendrogram
plt.figure(figsize=(8,5))
dendrogram(linked,
           orientation='top',
           distance_sort='descending',
           show_leaf_counts=True)
plt.title("Hierarchical Clustering Dendrogram")
plt.xlabel("Data Points")
plt.ylabel("Distance")
plt.show()

# Step 5: Agglomerative Clustering (choose 2 clusters)
model = AgglomerativeClustering(n_clusters=2, metric='euclidean', linkage='ward')
labels = model.fit_predict(X)
print("Cluster Labels:", labels)
Output: