DBSCAN Clustering
- DBSCAN is a density-based clustering algorithm that groups closely packed data points and identifies noise or outliers in datasets.
DBSCAN Clustering
DBSCAN (Density-Based Spatial Clustering of Applications with Noise) is an unsupervised learning algorithm used for clustering based on density.
It is especially useful for arbitrary-shaped clusters and handling outliers.Density-Based Clustering
Clusters are formed where points are densely packed together
Sparse regions are considered noise or outliers
Unlike K-Means, no need to specify the number of clusters
Epsilon (ε)
ε defines the radius of a neighborhood around a point
Points within this distance are considered neighbors
Minimum Points (MinPts)
MinPts = minimum number of points required to form a dense region (cluster)
Helps distinguish core points from border points
Core, Border, and Noise Points
How DBSCAN Works
Select a random point
Check ε-neighborhood
If neighbors ≥ MinPts → core point, form cluster
Expand cluster by recursively including neighbors
Repeat for all points
Points not in any cluster → noise/outliers
Example: DBSCAN
DBSCAN Clustering Example in Python for Detecting Clusters and Outliers
This Python example demonstrates how to use the DBSCAN clustering algorithm to group data points based on density. The code creates a dataset, applies DBSCAN with specified eps (neighborhood radius) and min_samples, and predicts cluster labels. It also identifies noise or outlier points (labeled as -1) and visualizes the clusters using Matplotlib.
# Step 1: Import Libraries
import numpy as np
import matplotlib.pyplot as plt
from sklearn.cluster import DBSCAN

# Step 2: Create Dataset
X = np.array([
    [1, 2],
    [2, 2],
    [2, 3],
    [8, 7],
    [8, 8],
    [25, 80]
])

# Step 3: Create DBSCAN Model
# eps = neighborhood radius, min_samples = MinPts
dbscan = DBSCAN(eps=3, min_samples=2)
labels = dbscan.fit_predict(X)

# Step 4: Print Cluster Labels
print("Cluster Labels:", labels)
# -1 means noise/outlier

# Step 5: Plot Clusters
plt.scatter(X[:,0], X[:,1], c=labels, cmap='plasma', s=100)
plt.title("DBSCAN Clustering")
plt.show()
Output:
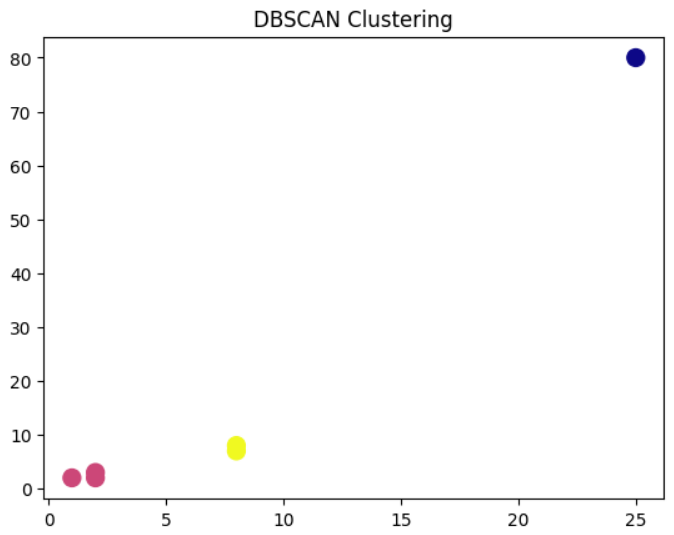
Cluster Labels: [ 0 0 0 1 1 -1]
Noise & Outliers
DBSCAN can detect outliers automatically
Points labeled -1 → noise
Advantage over K-Means which assigns every point to a cluster
Advantages & Limitations
Advantages
Detects clusters of arbitrary shape
Handles outliers/noise naturally
No need to specify number of clusters
Limitations
Sensitive to ε and MinPts parameters
Not effective for varying density clusters
Performance decreases on high-dimensional data