Decision Tree Classifier
- Decision Tree Classifier is a tree-based algorithm that splits data into branches based on decision rules to classify outcomes.
Gini Index
What is Gini Index?
Gini Index measures impurity or heterogeneity of a dataset.
Low Gini → Most samples belong to one class (pure)
High Gini → Mixed classes
Formula
Gini=1−∑i=1Cpi2Gini = 1 - \sum_{i=1}^{C} p_i^2Gini=1−i=1∑Cpi2
Where:
CCC = Number of classes
pip_ipi = Probability of class iii in node
Example
Suppose a node has:
10 samples: 7 Class A, 3 Class B
Gini=1−(0.72+0.32)=0.42Gini = 1 - (0.7^2 + 0.3^2) = 0.42Gini=1−(0.72+0.32)=0.42
Lower Gini → better split.
Entropy
What is Entropy?
Entropy measures uncertainty or randomness in the dataset.
Low Entropy → Most samples belong to one class
High Entropy → Classes are evenly mixed
Formula
Entropy=−∑i=1Cpilog2(pi)Entropy = - \sum_{i=1}^{C} p_i \log_2(p_i)Entropy=−i=1∑Cpilog2(pi)
Where:
pip_ipi = Probability of class iii
Example
Node with 7 Class A, 3 Class B:
Entropy=−(0.7log20.7+0.3log20.3)≈0.88Entropy = -(0.7 \log_2 0.7 + 0.3 \log_2 0.3) \approx 0.88Entropy=−(0.7log20.7+0.3log20.3)≈0.88
Information Gain
What is Information Gain?
Information Gain measures how much uncertainty is reduced after a split.
IG=Entropyparent−∑childrenNchildNparentEntropychildIG = Entropy_{parent} - \sum_{children} \frac{N_{child}}{N_{parent}} Entropy_{child}IG=Entropyparent−children∑NparentNchildEntropychild
Choose feature that maximizes Information Gain
Reduces impurity the most
Example
Parent Node Entropy = 0.88
Children Node Entropy (weighted avg) = 0.42IG=0.88−0.42=0.46IG = 0.88 - 0.42 = 0.46IG=0.88−0.42=0.46
Feature with highest IG → Best split.
Tree Pruning
Decision Trees can overfit if too deep.
What is Pruning?
Pruning removes unnecessary branches to simplify the tree and reduce overfitting.
Types of Pruning
Pre-Pruning (Early Stopping)
Stop tree growth based on:
Max depth
Minimum samples per leaf
Post-Pruning
Grow full tree first
Remove branches that do not improve test performance
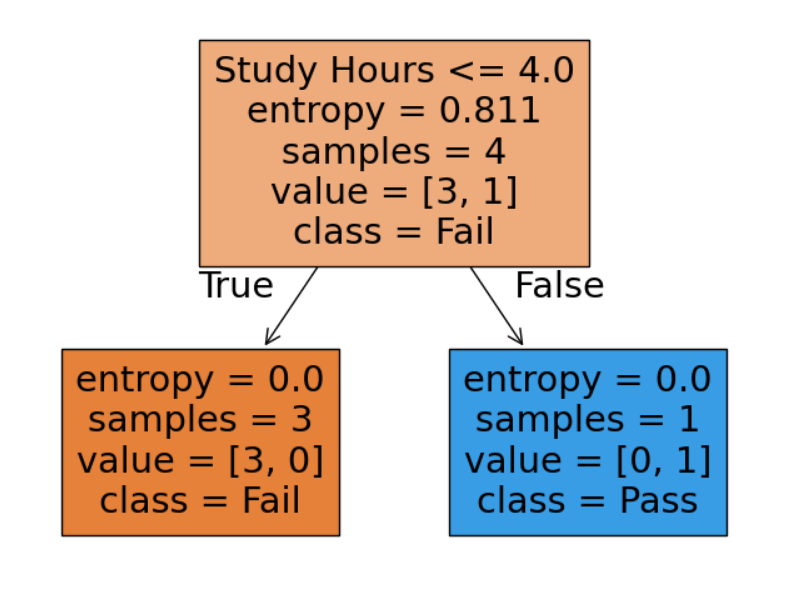
Example: Classify Pass/Fail Based on Study Hours
Decision Tree Classification Example in Python for Pass/Fail Prediction
This Python example demonstrates how to use a Decision Tree Classifier to predict whether a student will pass or fail based on study hours. The code creates a simple dataset, splits it into training and testing data, trains the model using entropy with pre-pruning (max_depth=2), and evaluates its accuracy. It also visualizes the decision tree using matplotlib to better understand how the model makes decisions.
# Step 1: Import Libraries
import numpy as np
from sklearn.tree import DecisionTreeClassifier
from sklearn.model_selection import train_test_split
from sklearn import tree
import matplotlib.pyplot as plt

# Step 2: Create Dataset
X = np.array([1, 2, 3, 4, 5, 6]).reshape(-1, 1)  # Study Hours
y = np.array([0, 0, 0, 1, 1, 1])  # 0=Fail, 1=Pass

# Step 3: Split Data
X_train, X_test, y_train, y_test = train_test_split(X, y, test_size=0.2)

# Step 4: Create Model with Pre-Pruning (max_depth=2)
model = DecisionTreeClassifier(criterion='entropy', max_depth=2)
model.fit(X_train, y_train)

# Step 5: Predict
prediction = model.predict(X_test)
print("Prediction:", prediction)
print("Accuracy:", model.score(X_test, y_test))

# Step 6: Visualize Tree
plt.figure(figsize=(8,6))
tree.plot_tree(model, filled=True, feature_names=['Study Hours'], class_names=['Fail','Pass'])
plt.show()
Output:
Prediction: [0 1]
Accuracy: 0.5
Key Points