K-Means Clustering
- K-Means is a popular clustering algorithm that divides data into K clusters based on similarity using centroid-based grouping.
K-Means Clustering
K-Means is an unsupervised learning algorithm used for clustering — grouping similar data points into clusters based on similarity.
Centroid Concept
Each cluster has a centroid (mean position of points in that cluster)
Algorithm assigns each data point to the nearest centroid
After assignment, centroids are updated iteratively until they stabilize
Steps
Initialize K centroids randomly
Assign each data point to nearest centroid
Recalculate centroids as mean of points in cluster
Repeat steps 2-3 until centroids do not change
K Value Selection
K = Number of clusters
Choosing the right K is critical for meaningful clusters
Common Methods:
Elbow Method
Silhouette Score
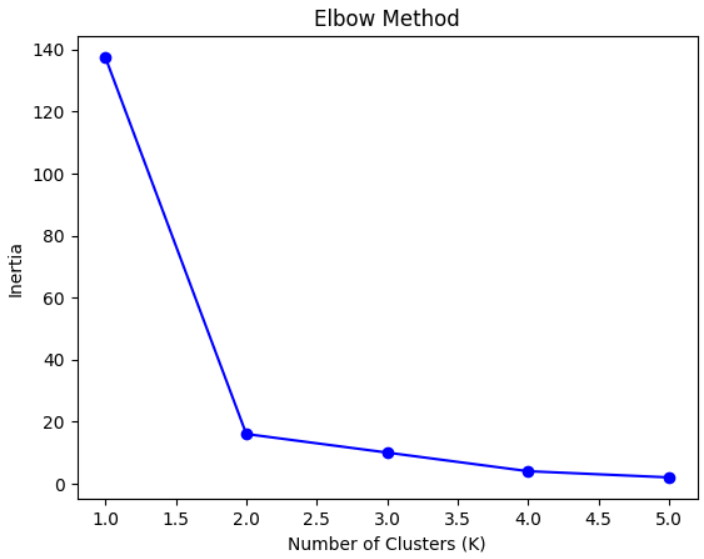
Elbow Method
Plot Inertia (within-cluster sum of squares) vs number of clusters (K)
Inertia = Sum of squared distances of points from their cluster centroid
Inertia=∑i=1K∑x∈Ci∣∣x−μi∣∣2Inertia = \sum_{i=1}^{K} \sum_{x \in C_i} ||x - \mu_i||^2Inertia=i=1∑Kx∈Ci∑∣∣x−μi∣∣2
Look for “elbow point” where inertia stops decreasing sharply → optimal K
Inertia
Measures compactness of clusters
Lower inertia → points closer to centroids → tighter clusters
Too low inertia → might overfit (too many clusters)
Advantages & Limitations
Advantages
Simple and easy to implement
Fast and efficient on large datasets
Works well for spherical clusters
Limitations
Need to specify K beforehand
Sensitive to initial centroid placement
Poor performance for non-spherical clusters
Sensitive to outliers
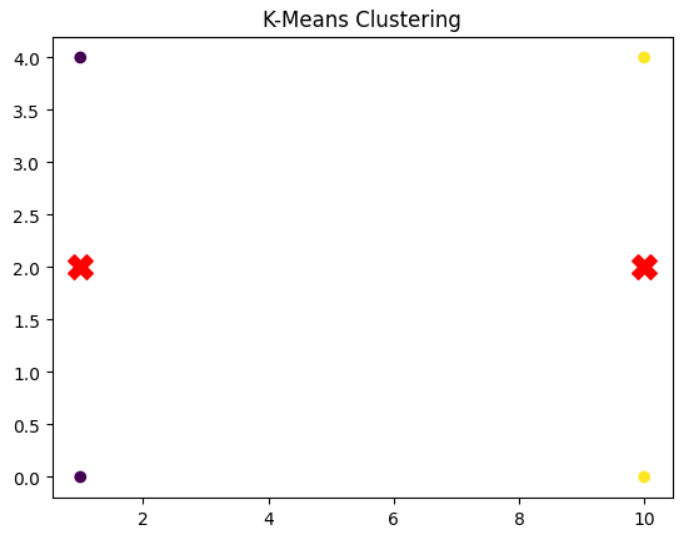
Example: K-Means Clustering
K-Means Clustering Example in Python with Elbow Method
This Python example demonstrates how to use the K-Means clustering algorithm to group data points into clusters. The code first applies the Elbow Method to determine the optimal number of clusters (K) by analyzing inertia values. After selecting K=2, it trains the K-Means model, predicts cluster labels, and visualizes the clusters along with their centroids using Matplotlib.
# Step 1: Import Libraries
import numpy as np
import matplotlib.pyplot as plt
from sklearn.cluster import KMeans

# Step 2: Create Dataset
X = np.array([
    [1, 2],
    [1, 4],
    [1, 0],
    [10, 2],
    [10, 4],
    [10, 0]
])

# Step 3: Elbow Method to find optimal K
inertia = []
K_range = range(1, 6)
for k in K_range:
    kmeans = KMeans(n_clusters=k, random_state=42)
    kmeans.fit(X)
    inertia.append(kmeans.inertia_)

# Plot Inertia vs K
plt.plot(K_range, inertia, 'bo-')
plt.xlabel("Number of Clusters (K)")
plt.ylabel("Inertia")
plt.title("Elbow Method")
plt.show()

# Step 4: Apply K-Means with K=2
kmeans = KMeans(n_clusters=2, random_state=42)
kmeans.fit(X)
y_kmeans = kmeans.predict(X)

# Step 5: Plot Clusters
plt.scatter(X[:, 0], X[:, 1], c=y_kmeans, cmap='viridis')
plt.scatter(kmeans.cluster_centers_[:, 0], kmeans.cluster_centers_[:, 1], s=200, c='red', marker='X')
plt.title("K-Means Clustering")
plt.show()
Output: