Introduction to Model Validation
- This lesson introduces the concept of model validation and explains why it is essential for evaluating machine learning models and preventing overfitting.
Why Model Validation is Important
Check Generalization: Ensures the model can predict well on new, unseen data.
Detect Overfitting/Underfitting: Helps identify if the model is too complex or too simple.
Compare Models: Validate multiple models to choose the best one.
Improve Reliability: Provides confidence that the model's performance is realistic.
Training Error vs Testing Error
Goal: Low training error and low testing error.
Typical Scenarios
Underfitting:
Training Error → High
Testing Error → High
Model too simple → fails to capture patterns
Good Fit (Generalization):
Training Error → Low
Testing Error → Low
Model captures patterns without overfitting
Overfitting:
Training Error → Very Low
Testing Error → High
Model memorizes training data → poor generalization
Overfitting & Generalization
Overfitting
Model fits training data too closely
Captures noise as patterns
Poor performance on new data
Solution:
Reduce complexity
Use regularization (L1/L2)
Use more data
Cross-validation
Generalization
Model's ability to perform well on unseen data
Balanced complexity → avoids overfitting & underfitting
Visual Example (Python)
Underfitting vs Overfitting Example in Python using Polynomial Regression
This Python example demonstrates the concept of underfitting and overfitting using Polynomial Regression. The code generates a dataset, splits it into training and testing data, and trains models with different polynomial degrees (1, 3, and 15). It then calculates the Mean Squared Error (MSE) for both training and testing sets and visualizes the errors using Matplotlib to show how model complexity affects performance.
import numpy as np
import matplotlib.pyplot as plt
from sklearn.preprocessing import PolynomialFeatures
from sklearn.linear_model import LinearRegression
from sklearn.metrics import mean_squared_error

# Generate dataset
np.random.seed(0)
X = np.linspace(0, 10, 20).reshape(-1,1)
y = np.sin(X) + 0.2*np.random.randn(20,1)

# Split data
X_train, X_test = X[:15], X[15:]
y_train, y_test = y[:15], y[15:]

degrees = [1, 3, 15]  # Linear = underfit, 3 = good, 15 = overfit
train_errors, test_errors = [], []

for d in degrees:
    poly = PolynomialFeatures(degree=d)
    X_train_poly = poly.fit_transform(X_train)
    X_test_poly = poly.transform(X_test)

    model = LinearRegression()
    model.fit(X_train_poly, y_train)

    y_train_pred = model.predict(X_train_poly)
    y_test_pred = model.predict(X_test_poly)

    train_errors.append(mean_squared_error(y_train, y_train_pred))
    test_errors.append(mean_squared_error(y_test, y_test_pred))

# Plot errors
plt.plot(degrees, train_errors, marker='o', label='Training Error')
plt.plot(degrees, test_errors, marker='o', label='Testing Error')
plt.xlabel('Polynomial Degree')
plt.ylabel('MSE')
plt.title('Training vs Testing Error')
plt.legend()
plt.show()- Output:
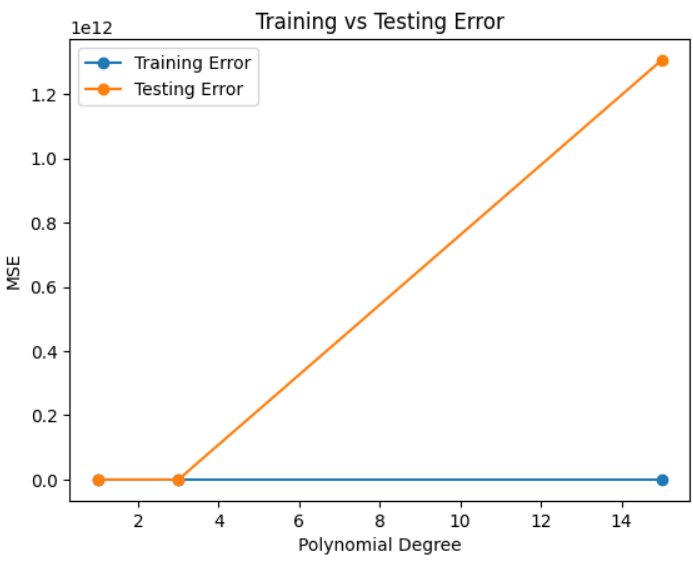
Observation:
Degree 1 → High train & test error → Underfitting
Degree 3 → Low train & test error → Good generalization
Degree 15 → Low train error, high test error → Overfitting